Quarterly Market Review: Q4 2023
By: Paul Dickson, Director of Research and Giri Krishnan, Senior Portfolio Manager
The “Soft-Landing” Has Become the Default Scenario
The Federal Reserve signaled that it is likely done with rate hikes. The markets responded favorably, nearly doubling the annual return on the S&P 500. This signaling also moved the U.S. Aggregate Bond market from being in the red to having a decisively positive year. The pivot in policymakers’ outlook was somewhat of a surprise given that the data-informed policy has not improved nearly as much as their stance has changed. While risks remain that the economy could slide into recession later in 2024, they have declined significantly.
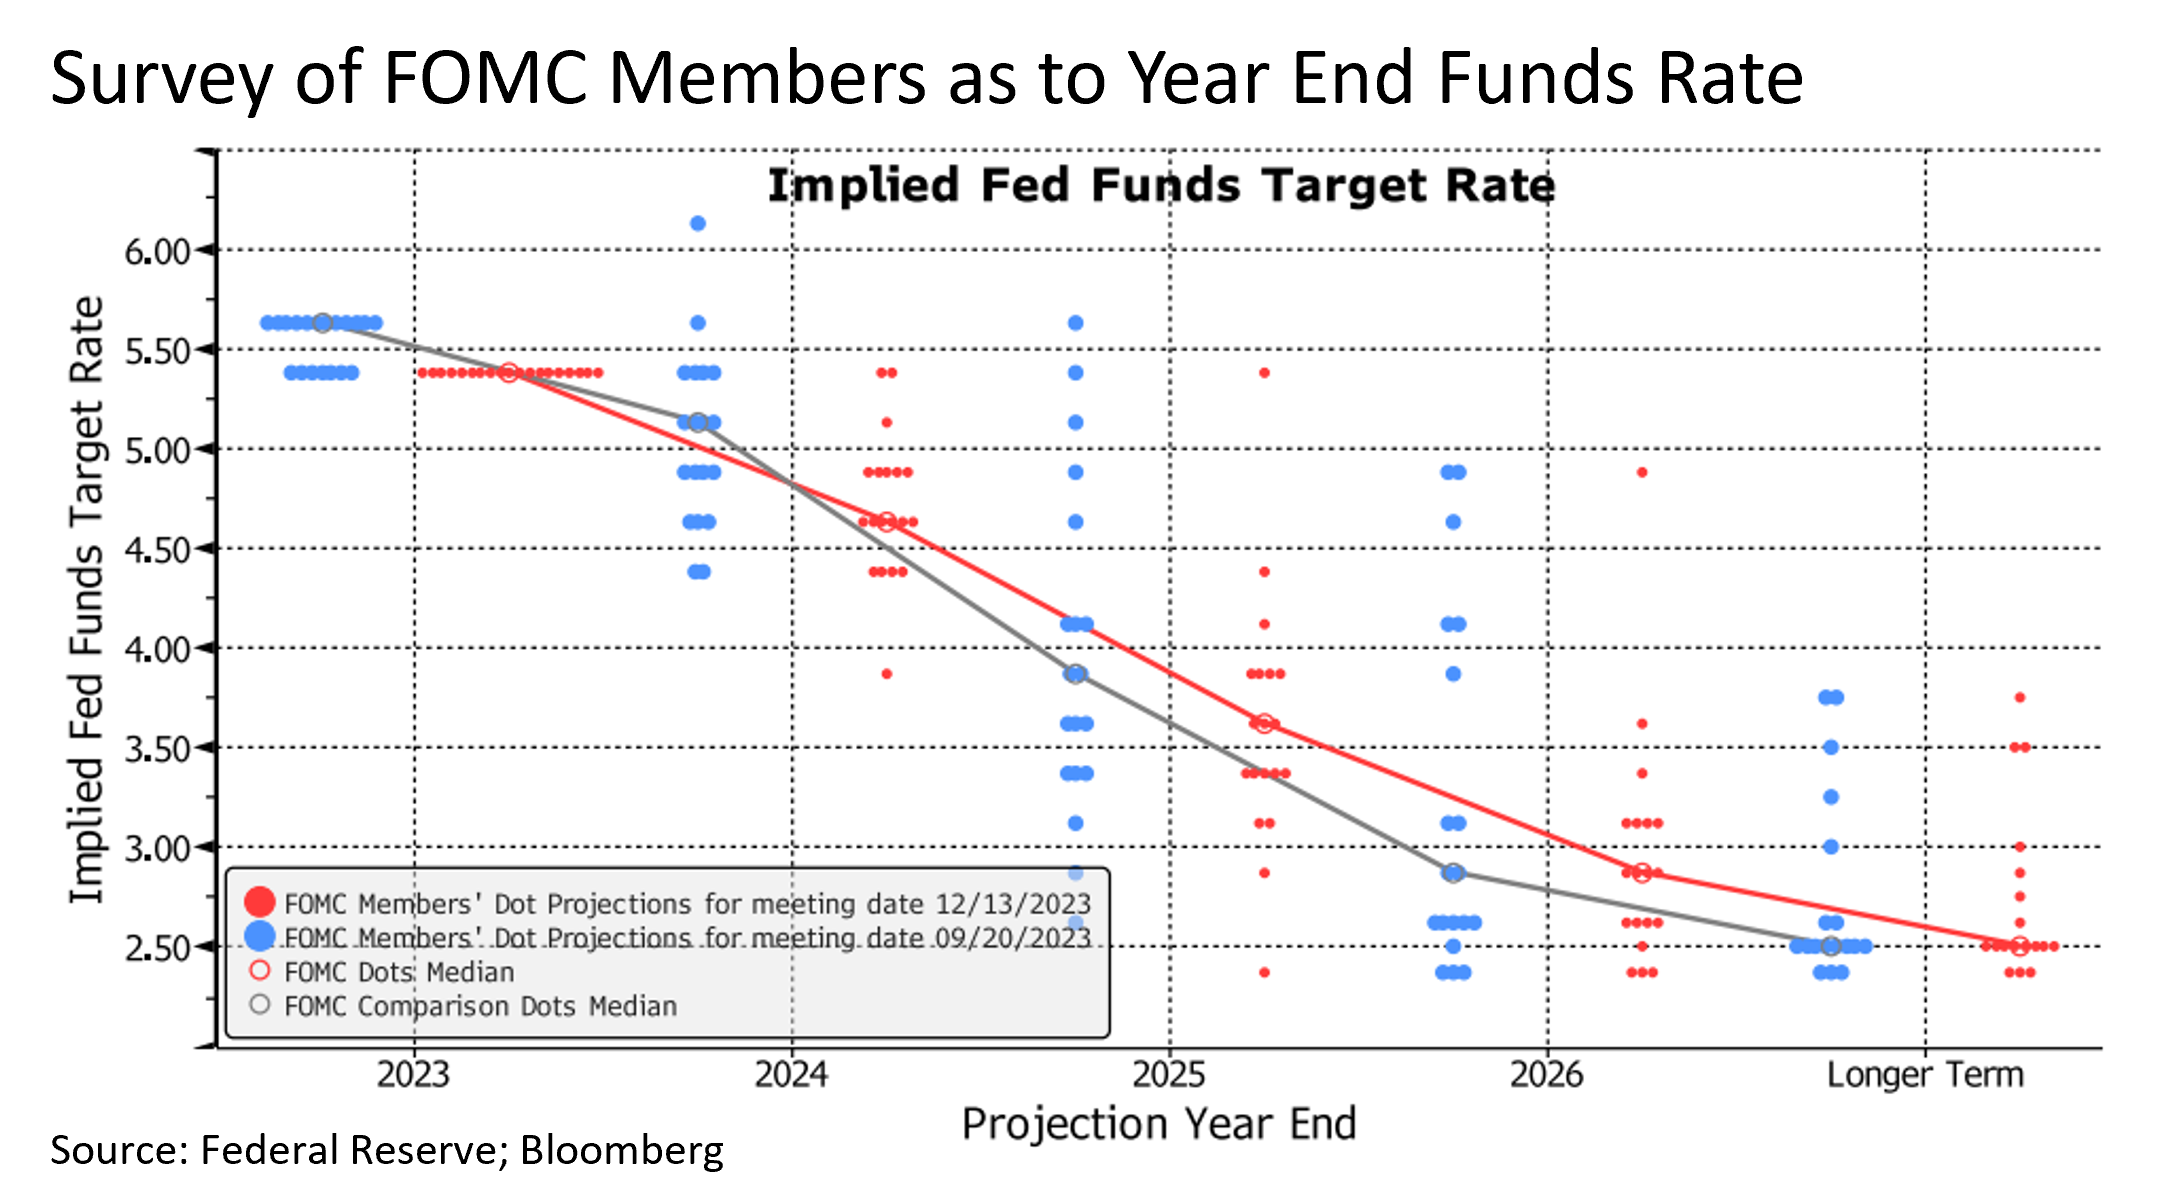
The most significant economic development in the fourth quarter of 2023 was the change in policy outlook by the Federal Reserve (Fed). The Fed was widely expected to signal continued vigilance against inflation and threaten additional possible rate hikes over the coming year; but instead, shifted to a decidedly softer tone and outlook. The survey of the Federal Open Market Committee (FOMC) members as to where they see the policy rate (Fed Funds) at the end of the coming year showed that none believe that rates would be raised. On average, they anticipate 0.75% worth of cuts in 2024.

The response provided by Chair Powell regarding the policy shift upon reaching the 2% inflation target is a clear indication of the changing tone at the Fed. He made it clear that the Fed is likely to initiate a reduction in interest rates well in advance of achieving the 2% inflation target. The release of the meeting minutes gave further evidence of their desire to ease monetary conditions this year, including possible changes in policy elsewhere, such as the QT (Quantitative Tightening) program.1
While prospects for the Fed lowering interest rates are welcome, the timing was something of a surprise as economic data remains outside Fed targets and has shown slower improvements in recent weeks. The Federal Reserve is considering the impact of a decelerating global economy, including the lackluster recovery in China, which has experienced deflation. This serves as further justification for the proposed policy shift.
Inflation Continues Above Target
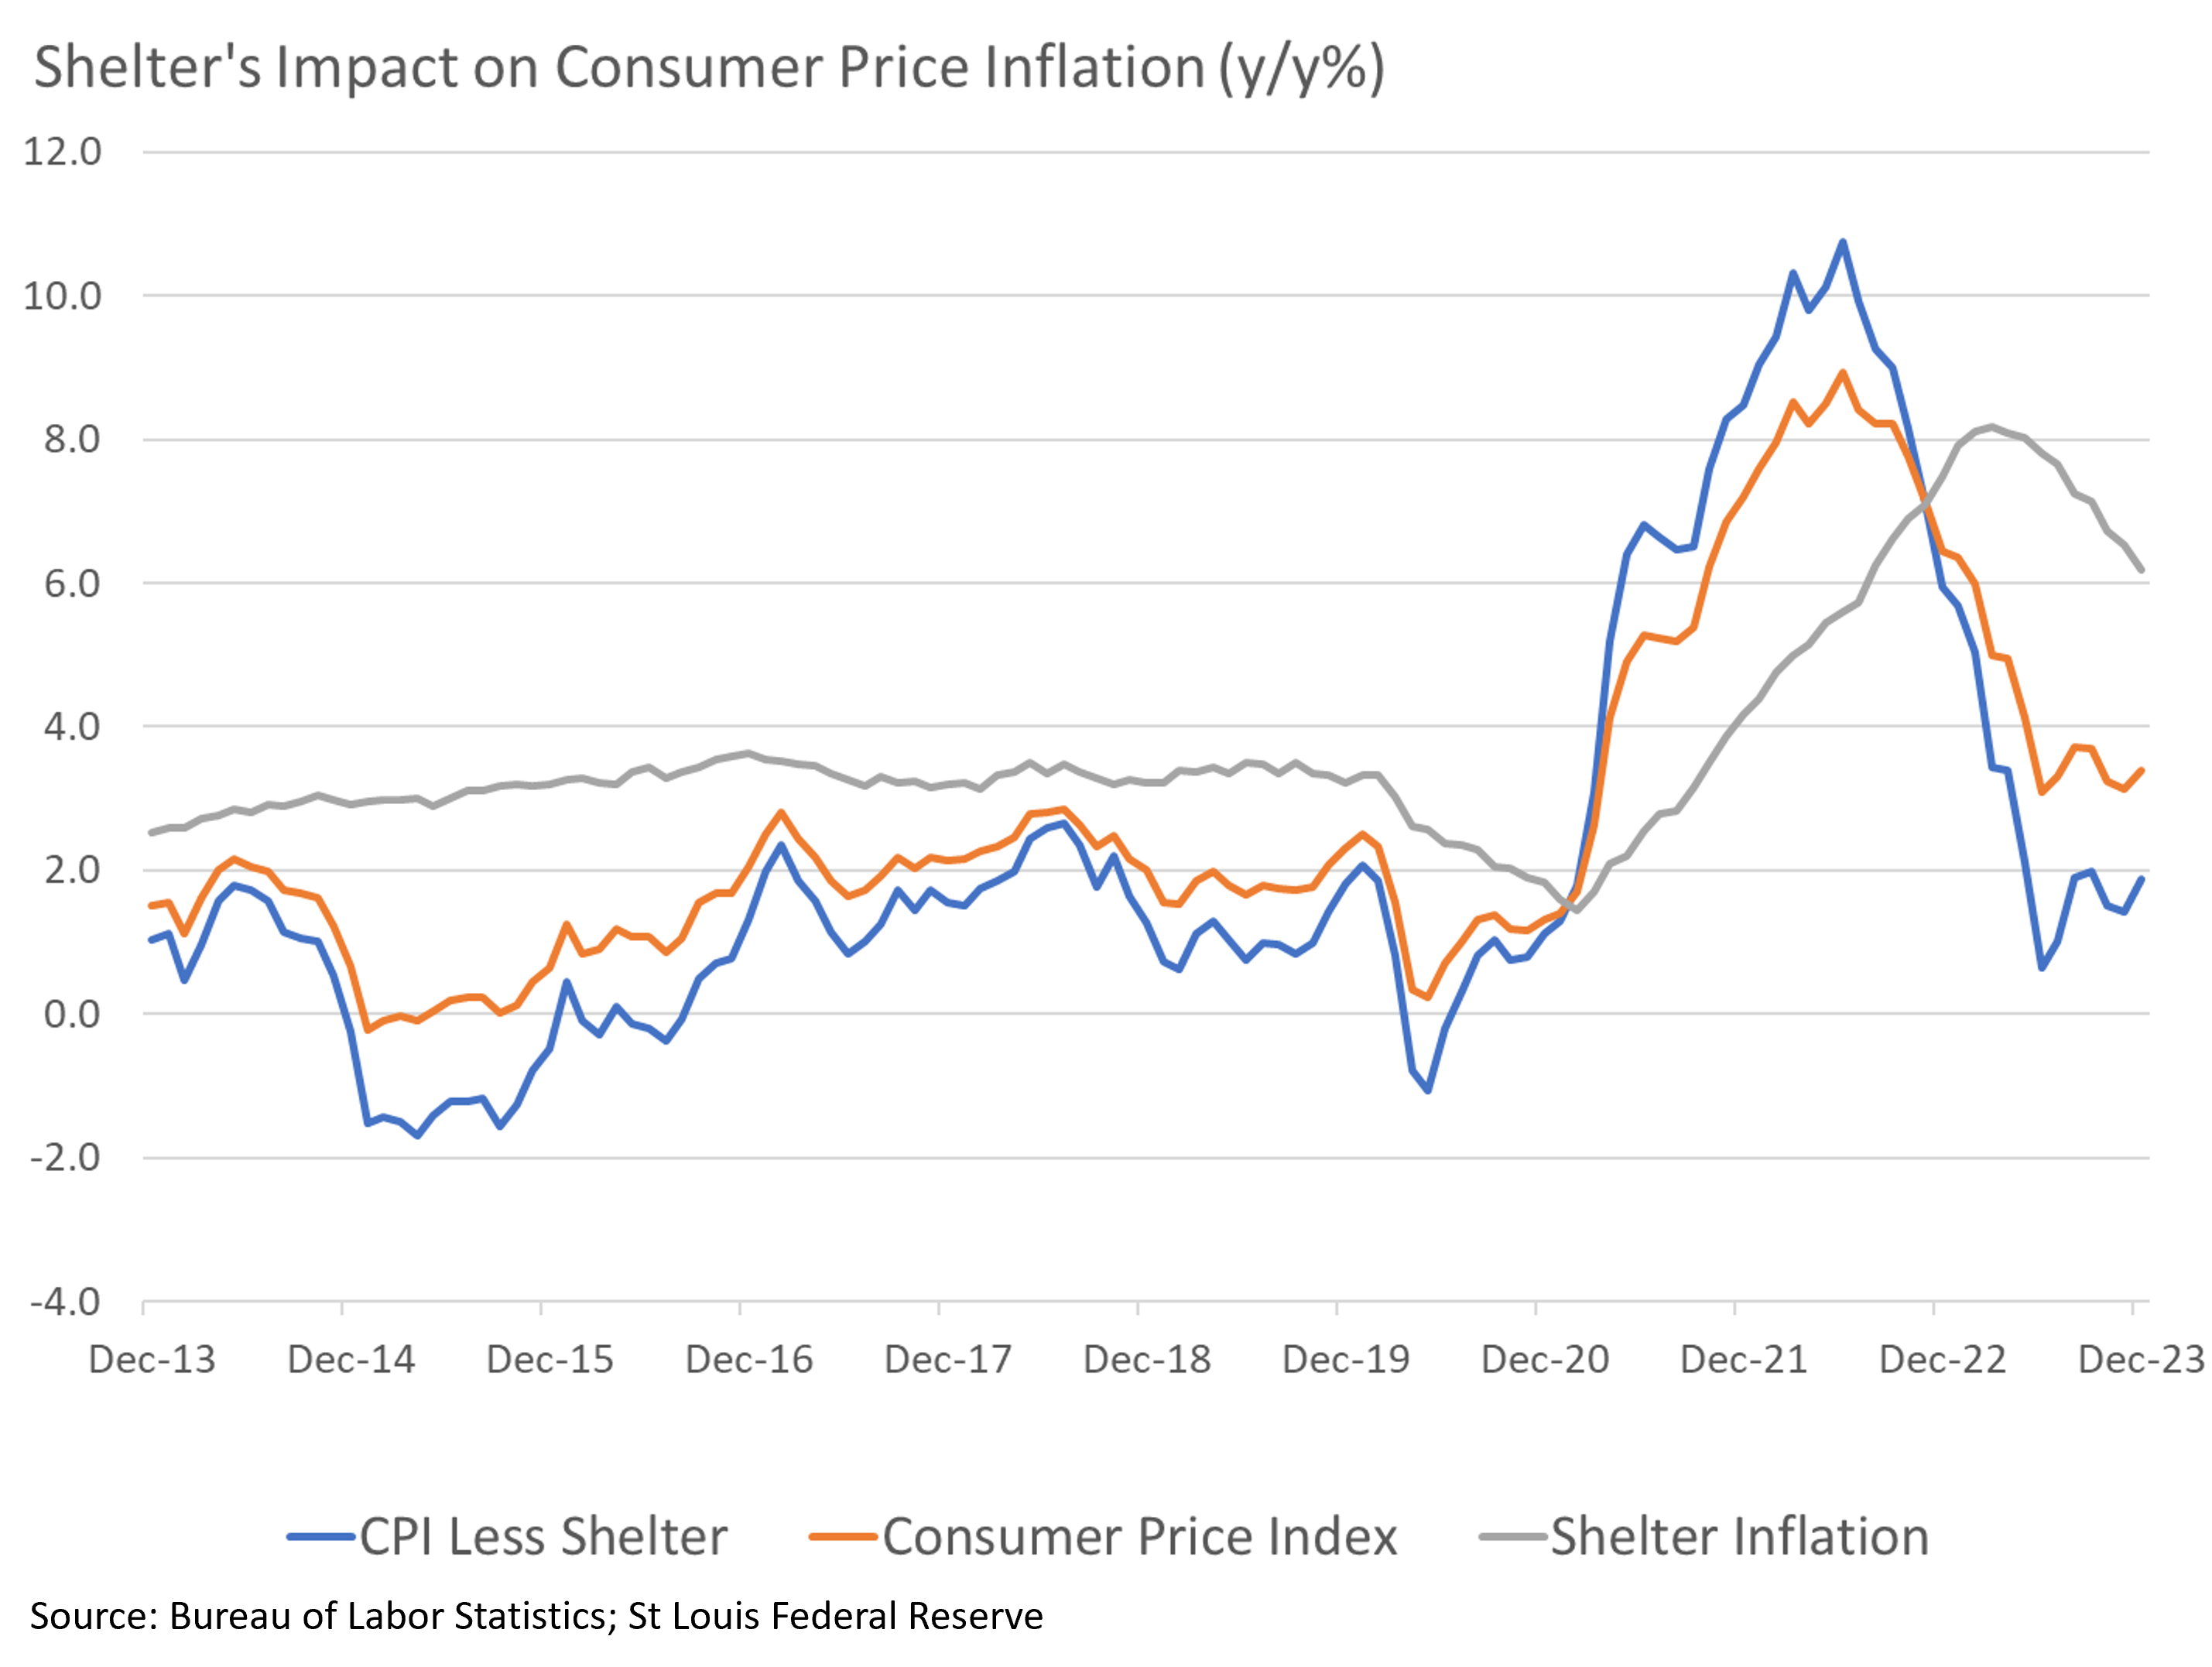
Inflation has been the greater preoccupation of the Fed’s two mandates, stable prices and full employment. The most recent Consumer Price Index (CPI) reading showed inflation rising at 3.4% year-on-year in December against expectations of 3.2%. This is higher than the 3.1% level of the prior month. While CPI is not the Fed’s preferred measure, it confirms that inflation’s decline has slowed from earlier in 2023 when great progress was made. The Core PCE (Personal Consumption Expenditures) Index is the targeted inflation rate, and, at 3.2% for the year to November, also remains above the 2.0% target. Concerns have been raised regarding the inflation of services, which currently stands at over 4.1%. This is a matter of increasing importance due to the fact that nearly two thirds of the economy is comprised of services, which in turn has a significant impact on labor and wages.
The problem with these headline figures is the overweight they give to housing. And apparently, the Fed is taking this into consideration. At a 35% weighting in the CPI, housing (aka Shelter) inflation at 6.2% year-over-year dramatically impacts the overall measure. If that number is stripped out, the headline CPI figure is below 2% (see Shelter’s Impact on Consumer Price Inflation chart). For Core PCE, it was 2.4% in November, and likely still lower as of year-end.

There are good reasons for stripping out housing, especially in the current environment. The first is that rising house prices do not directly impact most consumers as the majority own and have a fixed cost. Those who rent see an annual adjustment at worst. The second is that the rise in house prices primarily reflects a housing shortage. It has been estimated that the economy lacks between four and seven million housing units. Rising interest rates, aimed at lowering inflation, may be having the perverse effect of keeping house prices high as homeowners enjoying low mortgage rates are reluctant to move, further reducing supply. High capital costs also deter construction, further exacerbating the problem. And, of course, the measure of house inflation is based on surveys rather than sales data, so there are reasons to doubt the figure’s accuracy.
The Labor Market Remains Tight
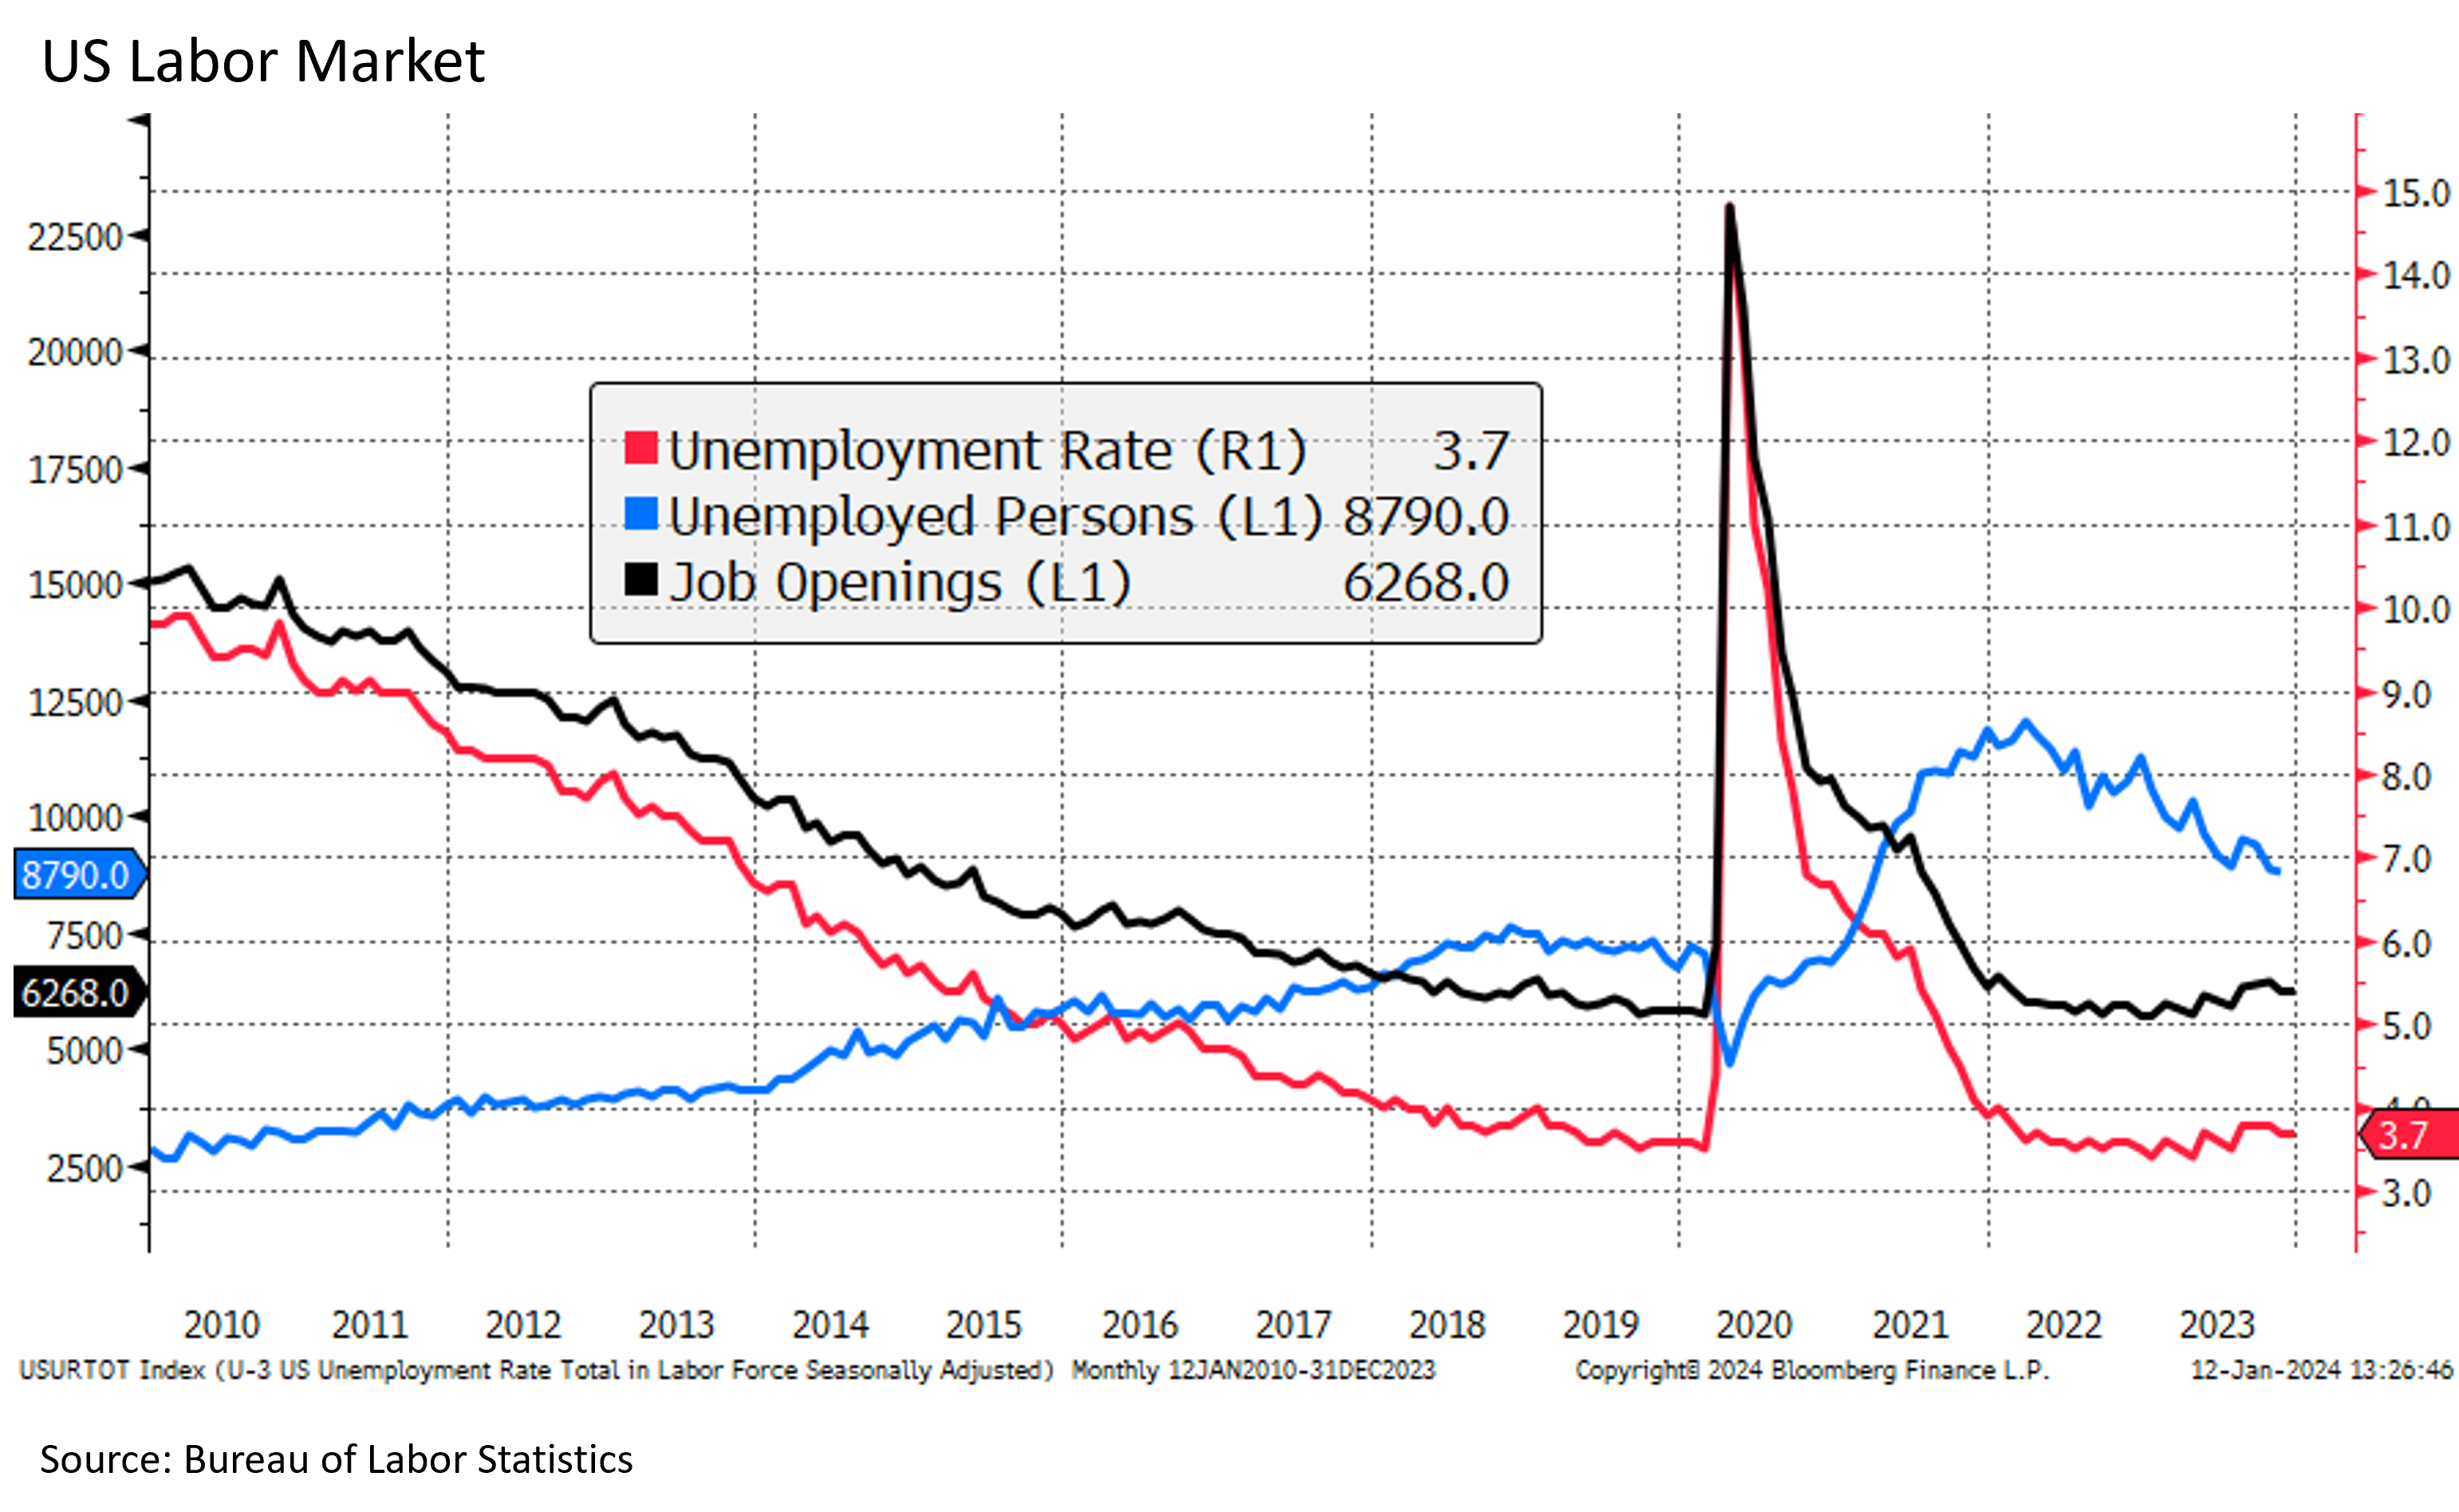
The Fed’s other mandate, full employment, is a problem in reverse because it already surpassed its goals. At 3.7%, the unemployment rate remains very close to 50-year lows and well below what most economists view as “full employment.” Here, the Fed would like to engineer some slack in the workforce before wage inflation becomes a systemic issue. Averting a wage-price spiral, as happened in the 1970s, is the concern, and a higher unemployment rate would be welcome. Unfortunately for the Fed, the unemployment rate has been falling since October.

There are some signs of hope. While the job opening number remains very high, there are some early signs of weakness. In the underlying data, the pace of voluntary resignations and new hires has been falling steadily. This could indicate a decline in workers moving between jobs and imply that the job opening data might be exaggerated. There is anecdotal evidence that fears of a repeat of the wildly tight labor market in the aftermath of COVID, coupled with the availability of cheap modern advertising methods, have led to a rise in “ghost jobs” – positions that only quasi-exist and are not actively being offered.
The Global Economy Might Help
The global backdrop might be an underappreciated ally in the battle against inflation. Many commodity prices have fallen, particularly oil, where prices per barrel have declined from the high $90s to the mid $70s since September. This has contributed to a softening of goods prices overall, leading to a decline of 0.3% year-over-year in the Fed’s PCE goods inflation measure. The impact of the economic situation in China is expected to play a significant role in this area. Despite high hopes for the world's second largest economy to stimulate global growth after the lifting of COVID restrictions, the outcome has been quite disappointing. China’s economy has fallen into deflation, which could have wide-ranging implications for global inflation.
The Outlook For 2024
Despite the most dramatic increase in interest rates in 40 years, the economy confounded most projections and avoided a recession during the past year. In hindsight, the consumer had greater pent-up demand and financial resources than had been appreciated. Government policies, including the Infrastructure Investment and Jobs Act, CHIPs and Science Act, and the Inflation Reduction Act, have directly heightened spending and investment by the government and incentivized private industry to do so as well. The global backdrop provided additional deflationary assistance, allowing the Fed more leeway in policy. This now appears to be on the verge of reversal, with a number of rate cuts expected over the coming year and no additional rate hikes.
Considering all this, the bond market anticipates rate cuts in the spring. The belief is that inflation will continue to fall towards the Fed’s target of 2% and implies that those cuts will be necessary as the economy flirts with recession. Studies have suggested that the COVID-era savings have been depleted among lower-income households and soon will be for everyone else. Credit card balances have risen significantly. This coincides with a marked rise in payment delinquencies for credit cards, auto loans, and mortgages. The recent resumption of student loan payments adds another source of stress for millions of consumers. Higher mortgage rates have slowed home sales, and this will dampen activity in many related sectors, from construction to household appliances. The commercial property sector has not recovered from COVID-era work transitions and is under pressure from higher interest rates, lower valuations, and more limited prospects. Private credit markets, undermined by higher interest rates, may hide undetected vulnerabilities. These developments imply a more fragile economy in the coming year and a growing likelihood of recession.
Standing in opposition to a recessionary outcome is an economy starting from a reasonably strong position. Unemployment remains near a multi-decade low, and a small rise, while unfortunate for those put out of work, would be more in line with a more balanced economy. A softening of this tight labor market would be a relief for policymakers, and many firms still need to fill vacant positions. In aggregate, consumer balance sheets are in good shape with debt to disposable income being in line with historic levels. Rising credit card debt is far from being worrisome, so consumers have significant borrowing capacity. Most of the banking sector is in good shape and the systemic problems that led to the Global Financial Crisis of 15 years ago are not apparent. House prices might come down in some markets, but with a housing shortage still generally present, a serious downward spiral is improbable. Finally, the Federal Reserve has significant room to cut interest rates to counteract a sharper than expected economic decline. Timed right, the easing of policy might be just enough to land this economy as if on a pillow. On balance, a mild recession in the second half of the year seems possible, but the likelihood of a “soft landing” has rarely seemed higher.
Markets In 2023 – Global Economic Growth Was Modest, But Global Markets Were Resilient
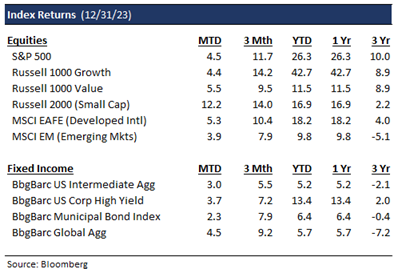
2023 was not supposed to be a great year for the U.S. economy or markets. In the first half of the year, we anticipated a series of well-documented headwinds to roil markets. These included a deceleration in economic growth, the Fed’s steadfast march to combat inflation by raising rates, tighter lending conditions for businesses, cash-strapped consumers and obstacles to corporate earnings growth. In addition, we encountered an unexpected challenge: the widely-covered implosion of Silicon Valley Bank (SVB), which set off a chain reaction that brought a few banks to their knees. The second half of the year was supposed to feature a recovery. While things looked dicey through the end of October, most global equity markets (with the exception of China) had a good year by any yardstick, including the S&P 500, which rose in the fourth quarter partly due the Fed’s pivot from hawkish to dovish. After an awful 2022, fixed-income markets also had a better year, with short-duration U.S. bonds outperforming long-duration bonds and the Global Bond Aggregate matching its U.S. counterpart.
The 2023 S&P 500 Index Returns (seen below) largely followed a similar cadence as they have for the past 50 years. This familiar rhythm included summer and third quarter doldrums followed by a classic year-end performance chase by investors. Statistically speaking, 2023 S&P 500 returns were the sixth best since the turn of this century, after the index endured its third worst year in 2022. With the 2023 projection of U.S. GDP growth approaching the 2% mark and corporate earnings rebounding in the third quarter, sectors with a growth focus, such as technology and consumer discretionary, have regained prominence over value-oriented sectors like energy, utilities, and consumer staples. Developed and emerging markets collectively lagged the S&P 500’s performance, up 17% and 6%, with the latter weighed down by China’s second consecutive year of double-digit negative returns (ranking it last among major emerging markets). Short-term cash instruments (money market funds, short-term Treasury bills, CDs) offered 5% and up yields not seen in over 15 years.

What’s Likely Ahead: A Soft Landing, Election-Related Noise, Fed Tailwinds (?) and Higher Volatility
Contrary to the prevailing consensus market view at the start of 2023, the recent torrid run across most classes in November and December has shifted the consensus to mildly bullish. The consensus market view now calls for a modestly positive (low to mid-single-digit return) year for stocks and bonds and a soft landing. This is hard to call given that some of the traditionally reliable economic indicators have sent conflicting signals. Typically, an inverted yield curve is a precursor to a recession within a 6-18-month period. The ripple effects of Fed tightening are felt by 18 months, but seeing as neither scenario has played out, we are in somewhat unchartered territory. Typically, when bull markets such as the current one (which began in October of 2022) lift U.S. equity markets up 20% or more after a down year like 2022, the next market year has usually been positive as upward market momentum persists and economic tailwinds fade.
Historically, while the third year of a U.S. Presidential cycle (here, 2023) typically has the strongest returns, the Presidential election year has seen the second highest returns for the S&P 500, with the index up nearly 75% of the time. While the first few months of an election year typically have trended lower relative to non-election years, markets in the U.S. have generally trended higher in the 12 months after primaries ended. While we expect a lot of noise, especially as elections approach, our investment choices are not influenced by whether we get a Democratic or Republican president. When we consider 10-year U.S. equity market returns starting January 1st of an election year, it should be noted that performance has been virtually identical regardless of which party took over.Historically, while the third year of a U.S. Presidential cycle (here, 2023) typically has the strongest returns, the Presidential election year has seen the second highest returns for the S&P 500, with the index up nearly 75% of the time. While the first few months of an election year typically have trended lower relative to non-election years, markets in the U.S. have generally trended higher in the 12 months after primaries ended. While we expect a lot of noise, especially as elections approach, our investment choices are not influenced by whether we get a Democratic or Republican president. When we consider 10-year U.S. equity market returns starting January 1st of an election year, it should be noted that performance has been virtually identical regardless of which party took over.
In 2024, we expect the cliché ‘don’t fight the Fed’ should aid rather than hinder market performance unless any rate cuts put in place are done primarily to ward off a steep economic downturn. December’s Federal Reserve meeting featured Chairman Powell’s confirmation that the Fed was indeed pivoting from hawkish to dovish. This was following a string of PCE readings which indicated inflation (barring any unforeseen events) was well under control and on its way to the Fed’s 2% target. Hence, after a nearly two-year stretch of obsessing over how many rate hikes the Fed might make to curb inflation, we have reached a pivotal moment where investors are now trying to gauge how many rate cuts will occur in 2024 (the Fed’s dot plot contemplates three rate hikes, while the market seems to be pricing in six or higher). The shift in Fed tone, coupled with improving corporate earnings, was partly responsible for cementing the 2-month November and December stretch’s historical reputation as the best in the annual calendar for U.S. markets.
Correspondingly, investor sentiment on stocks has also turned bullish. The latest American Association of Individual Investors (AAII) survey showed that over 46% of investors expect stock prices to rise over the next six months, while 25% expect stock prices to fall, which would be 6% points above and below historical averages respectively. Both bond and stock market activity has tracked this sentiment lately, with the MOVE and VIX indices (gauges of U.S. interest rate and S&P 500 market volatility) plunging since October, and this investor complacency implies higher volatility later in the year.
Portfolio Implications – U.S. Equities Likely Facing a Sector Rotation, Core Bonds More Appealing Over Cash, International Markets Cheaper, 60/40 Rebirth, Liquid Alternatives Still Key
Ahead of the Fed’s tightening moves in 2023, we were skeptical of longer-term bonds and preferred shorter-duration bonds instead. After the unprecedented 500+ bps hike in rates since March 2022, cash-like instruments such as CDs, money-market funds and shorter-term Treasury bills have offered yields in the 5% range, pushing such assets to over $6 trillion. However, now that the Fed has indicated it may be on an easing path even as inflation fades, we believe it is high time that investors extended duration based on well-documented history. Typically, when the Fed is close to the end of its hiking cycle, it has paid to own either core bonds or equities over cash since they have each outperformed the latter over the one and five years after the last rate hike. Since money-market assets and short-term bonds would face re-investment risk in an easing cycle, we favor adding to core bonds in the belly of the curve. Also, based on the last five Fed cycles, stock and bond returns have been higher during the pause (typically ten months between the last rate hike and the first rate cut) than in the periods immediately after.
Accordingly, we have been working on increasing the duration of our fixed-income portfolios. While we would not rule out the miniscule odds of a 1970s style resurgence in inflation, which would leave the door open for one last rate hike or two, we believe that investors should lock in higher yields before rates head south. As they say, rates typically take the escalators up and the elevator down. Investors seeking better value should consider intermediate-term bonds with a yield of 5% or higher. When assessing valuations for stocks versus bonds, the earnings yield (the inverse of the PE ratio) serves as a reliable indicator. In comparison, the S&P 500 currently trades at 19 times forward earnings with an earnings yield below 5%. Contrary to claims in 2022 that the 60/40 balanced portfolio was dead, 2023 saw the rebirth of the 60/40, with the portfolio up over 12%. Within our diversified portfolios, therefore, we tailor the mix of bonds and stocks to an investor’s risk versus return profile. With rates over 4% across most global markets, investors now have more choices with which to build a globally diversified portfolio than at any time over the last decade.
For equities, the year-end rally was driven partly by the expectation of a loosening credit environment, better-than-expected third quarter corporate revenue and earnings growth and the realization that earnings growth may have bottomed, leaving the S&P 500 and the Nasdaq within striking distance of all-time highs last seen in late 2022 and early 2023. 2023’s equity rally was largely driven by growth technology, communication services and consumer discretionary sectors, while defensive sectors such as healthcare and bond proxies like utilities and real estate lagged. While we expect the technology sector and some or all of the “Magnificent Seven” stocks (Apple, Amazon, Alphabet, Meta Platforms, Microsoft, Nvidia and Tesla) to still be a prominent story in 2024, we believe there may be a catch-up trade in areas of the market left behind last year, such as cyclicals, healthcare and dividend-oriented sectors like real estate. On a forward price-to-earnings (PE) multiple basis, the S&P 500’s 19 times forward PE makes it 10% overvalued relative to historical averages. Historically, 5-year forward returns for the S&P 500 have averaged 5% at these valuation levels; however, if we strip out the “Magnificent Seven”, the rest of the index trades at a more modest 16 times Forward PE multiple. Ditto for small-mid caps, which trade at a cheap 14-15 times forward PE multiple relative to growth. We expect equity market performance in 2024 to be driven more by earnings growth than multiple expansions.
With fourth quarter earnings season just beginning, market projections indicate a 12% Year-over-Year (YoY) growth in earnings per share (EPS) for the S&P 500 in 2024, which would put the S&P 500's estimated EPS at $246. This may be a tad too optimistic, given revenue growth has been slowing and companies face challenges in passing price increases to consumers in a lower inflation environment. We expect corporate earnings growth to benefit from leaner cost structures and lower input costs as supply chain issues have subsided. We are not ready yet to pick a side between growth and value; hence, we are keeping portfolios relatively style neutral with a bias toward large-cap. However, should we see markets turning a corner and earnings growth accelerating, we would take a more aggressive posture toward small-cap equities, which have notably trailed large-cap equities over the past ten years but have appreciated double-digits since early November. With the Fed on a path toward potentially easing faster than other global central banks, we also see the potential for dollar weakness. This would make developed international markets (trading at a 15% discount to U.S. equity markets) and emerging markets a worthy addition to our diversified portfolios despite a 10-plus--year stretch of relative underperformance compared to U.S. markets.
Finally, a word on Alternatives. Across most of our diversified portfolios, we believe having a healthy allocation to liquid alternatives (e.g. Long/Short Funds, Global Infrastructure, Real Estate) has the potential to lower overall portfolio volatility while not sacrificing returns. For instance, a JP Morgan study shows over the past 30+ years, modifying a 60/40 portfolio to a 40% Equities/30% Fixed Income/30% Alternatives portfolio has the potential to slash portfolio volatility by a third, while modestly enhancing returns. While 2023 was a heady time for more alternative categories such as real estate since financing costs rose steeply, thus constraining new transactions and fundraising, 2024 might see a pickup in both. However, we expect categories like venture capital will continue to feature portfolio markdowns, especially across late-stage companies. Given that the return dispersion between the top and bottom quartile managers in the alternatives universe can be much more significant than in public markets, we expect to spend a lot more time on alternatives manager selection in the months ahead.
Stay tuned for our thoughts on these and other relevant market topics in the upcoming quarters!
1The policy of reducing the Fed’s large balance sheet of bonds purchased in the wake of the financial crisis and then COVID to stimulate the economy. Slowing the pace at which the Fed allows the balance sheet to shrink would improve market liquidity and help lower interest rates.
Wealth Management does not provide accounting, legal or tax advice. This information discusses general economic and market activity and is presented for informational purposes only and should not be construed as investment advice. Views and opinions expressed herein do not account for any specific investment objective, restrictions, and/or financial circumstances of any specific client. Investors are urged to consult with their financial advisors before buying or selling any securities.
Different types of investments involve varying degrees of risk, and there can be no assurance that any specific investment will either be suitable or profitable for a client’s investment portfolio. The investment return and principal value of investment securities will fluctuate based on a variety of factors, including, but not limited to, the type of investment, amount and timing of investments, changing market conditions, currency exchange differences, stability of financial and other markets, and diversification. The statements and opinions expressed in this article herein are those of the author as of the date of the article and are subject to change. Content and/or statistical data may be obtained from public sources and/or third-party arrangements and is believed to be reliable as of the date of the article.
Products offered through Wealth Management are not FDIC Insured, are not bank guaranteed and may lose value.

